We’re sure you’ve already tried our charts feature – easy to create, but so practical and useful for representing data to clients! Our team went ahead and added some 3D types of diagarms. Let’s look how to create such charts in this article.
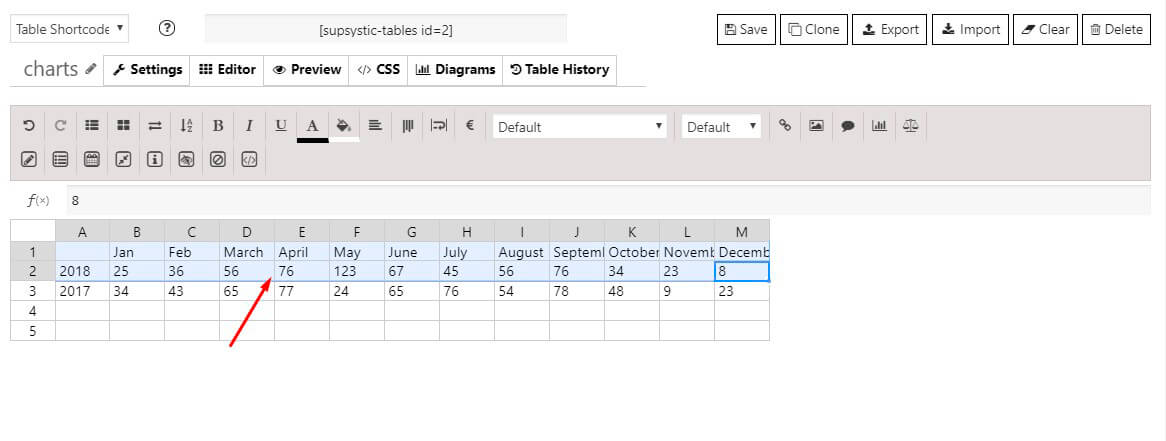
Open a table your need. Select data for chart:
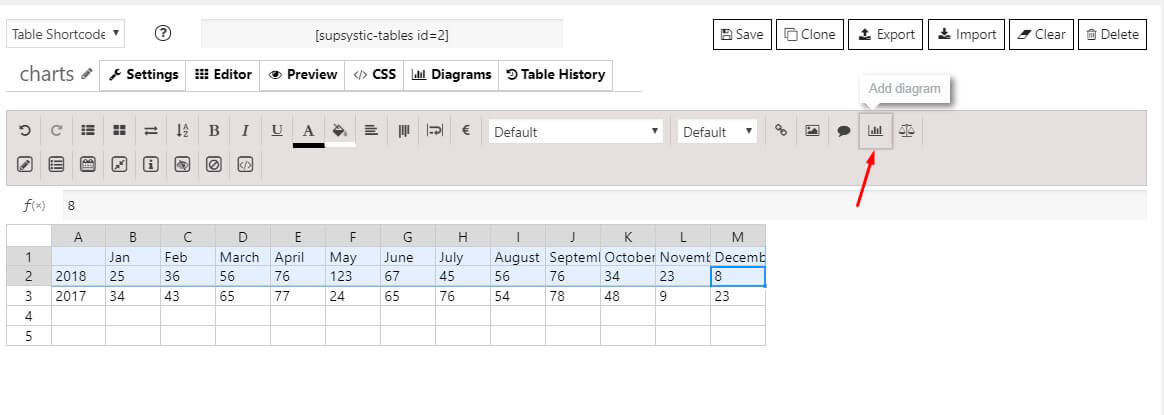
Go to “Charts” feature in the editor:
In the bottom of the list, there are 4 new 3D diagram types… We’ll try rounded one:
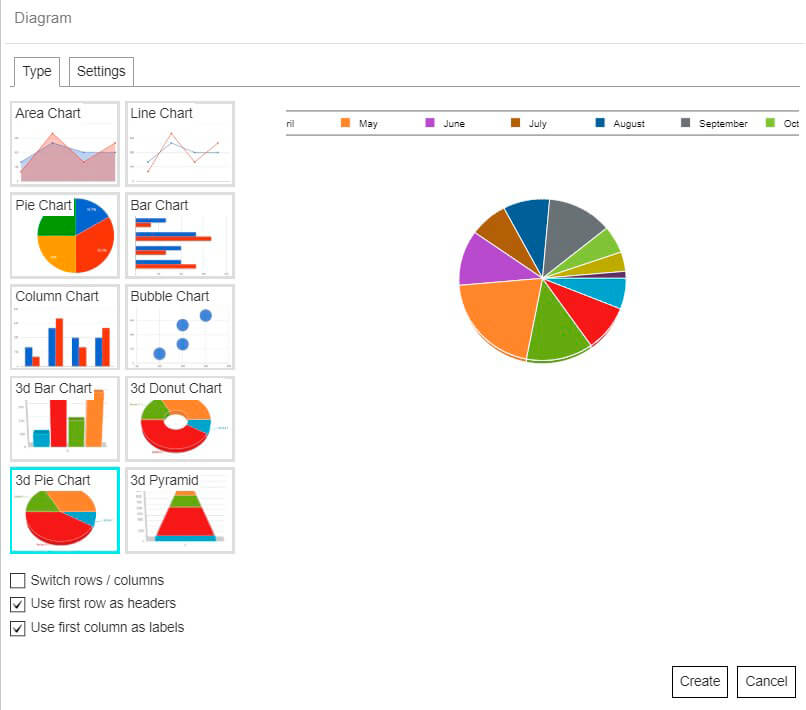
3D charts have the same settings, as usual, do, but there is also an ability to change axes angles:
We’ve customized our chart a little to make it more pleasant-to-eye, and are ready to insert it to page content.
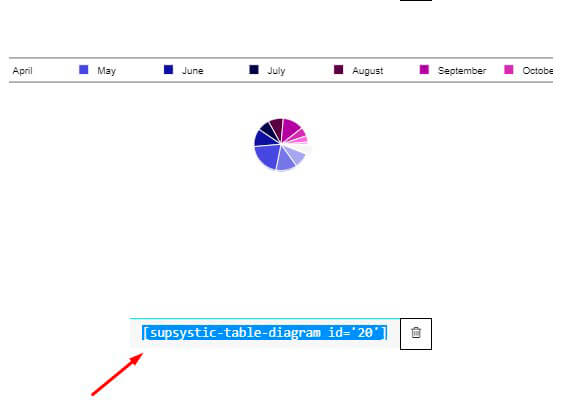
 Press “Create” button, and move to the Diagrams tab. Find your chart there, copy its shortcode and insert it into a page.
Here you can see couple of examples of our 3D charts:
Video tutorial: