While Google Maps Easy allows you to add unlimite markers, there are some things that can be represented visually only.
With Figures Feature, you can create polygon and circle shapes and polylines on your map with an easy to use interface.
- Polygon. When creating a polygon you can define the colors, widths and opacity values for the edges of the line and its covered area (fill).
The shape gets created based on points. In case you want to change one of the edges of the shape, you can create new one, change the coordinates or remove a point.
You can provide a Figure title and description, using text, photos, videos ans links for the polygon overlay.
If you add a marker, trying to specify a particular area (f.e the West of NY), your users may not understand the limitations of area. For such case is useful to add a Polygon or Circle to the map to show the exactly location.
- Circle. Here you can set the colors, widths, radius and opacity values both for the edge of the circle (line) and its covered area (fill).
There are 3 ways of adding the center of the circle – providing address, filling in longitude and latitude or right-clicking on the location on the map.
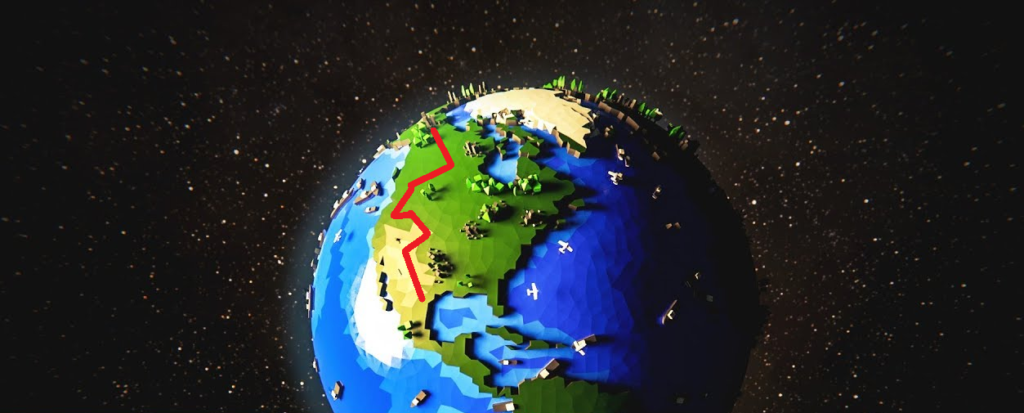
- Polylines do the same thing, but with a single line instead of a shape.
Polylines is a shape created using multiple points. Based on the number of used points, the polyline can have from two up to any number of lines.
Polylines are perfect if you want to show your users the exact rout on map.