Although presenting data tables of numbers can be very informative, they may have lack of visual impact. Especially statistic data, results of scientific experiments, for graphical methods of research and many others. With Google Charts and Diagrams of Data Table WordPress plugin Generator it begins to be available in your back-end!
Create diagrams, charts and graphics instantly and with lots of essential parameters, that you dreamed about for such a long time!
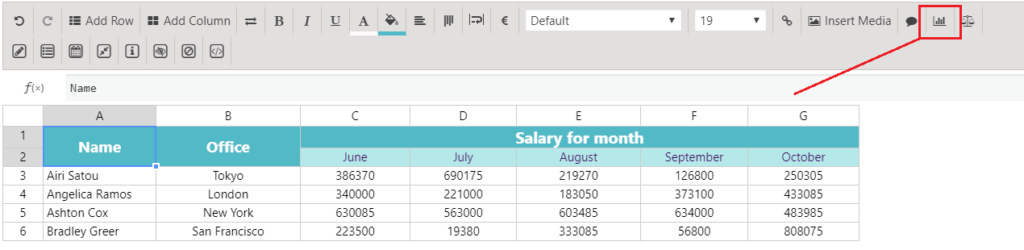
Diagrams can help by summarizing the key features of the data and to represent them in a very informative and outstanding way. Here, on these examples you can see different graphs of sales for several months of four different offices.
| Name | Office | Salary for month | ||||
| June | July | August | September | October | ||
| Airi Satou | Tokyo | 386370 | 690175 | 219270 | 126800 | 250305 |
| Angelica Ramos | London | 340000 | 221000 | 183050 | 373100 | 433085 |
| Ashton Cox | New York | 630085 | 563000 | 603485 | 634000 | 483985 |
| Bradley Greer | San Francisco | 223500 | 19380 | 333085 | 56800 | 808075 |
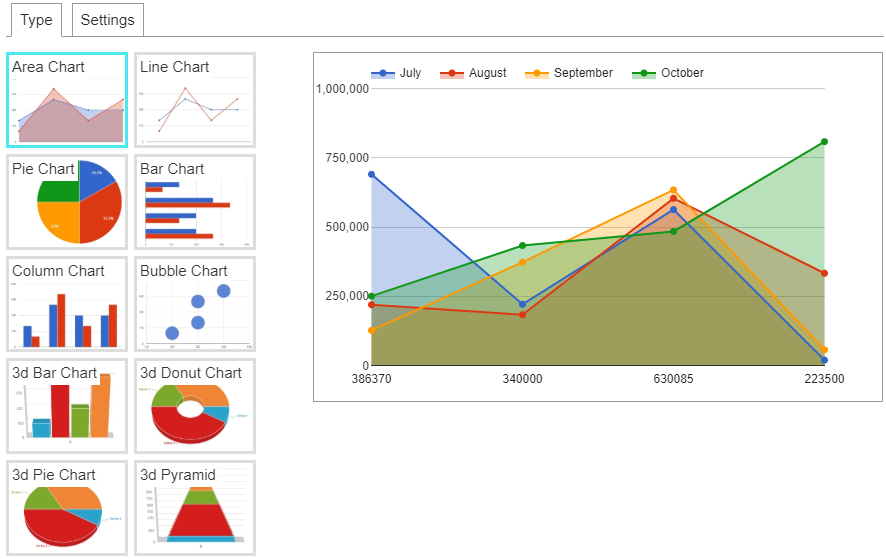
Area Chart
Line Chart
Pie Chart
Bar Chart
Column Chart
Bubble Chart
3D Bar Chart
3D Donut Chart
3D Pie Chart
3D Pyramid
In order to create such amazing Google Charts and Diagrams to the WordPress you need:
- Select the required data in the table and click on button “Add diagram”
- In “Diagram” popup window choose type of diagram, customize it and click “Create” button.
- To use diagram on your site – copy shortcode under the diagram on Diagrams tab and paste it into the page or post.
WordPress Data Table Charts and Graphs plugin is a powerful tool to create, manage and embed interactive charts into your WordPress posts and pages.
WordPress Data Table Charts and Graphs plugin uses Google Visualization API to render charts, which support cross-browser compatibility (adopting VML for older IE versions) and cross-platform portability to iOS, Android and Blackberry releases.
WordPress Data Table Charts and Graphs plugin provides a variety of charts that are optimized to fulfill your data visualization needs. It is line chart, area chart, bar chart, column chart, pie chart, geo chart, gauge chart, candlestick chart and scatter chart. These charts are based on pure HTML5/SVG technology (adopting VML for old IE versions), so no extra plugins are required. Adding these charts to your WordPress page can be done in a few simple steps.