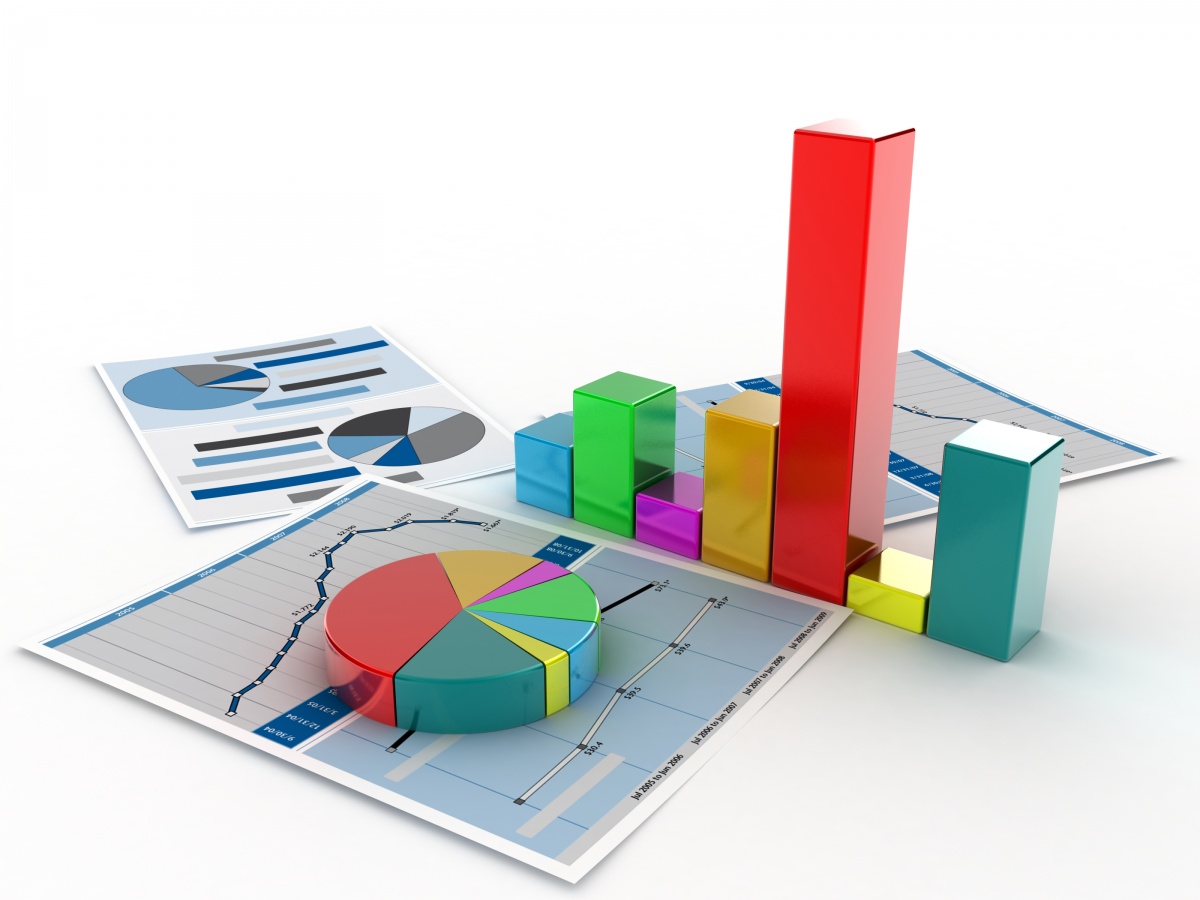
Although presenting tables of numbers can be very informative, they can lack visual impact. With Google Charts and Diagrams of WordPress Data Table plugin create diagrams, charts and graphics instantly! Diagrams can help by summarizing the key features of the data, and representing it as a picture. A diagram is essentially a picture that communicates information. You can often explain statistical data and other important information. This is especially important in the business world where information constantly disseminates and the need for accuracy, speed and comprehension is paramount. Tables can be useful if trying to show comparisons between certain types of data, such as what services each department provides. However, tables may be less effective if trying to show a trend over time, such as dynamics of sales for each month. That would be better demonstrated using diagrams. For example, here is the table with data of sales of four different offices for several months.
| Name | Office | Salary for month | Salary for month | Salary for month | Salary for month | Salary for month |
| June | July | August | September | October | ||
| Airi Satou | Tokyo | 386370 | 690175 | 219270 | 126800 | 250305 |
| Angelica Ramos | London | 340000 | 221000 | 183050 | 373100 | 433085 |
| Ashton Cox | New York | 630085 | 563000 | 603485 | 634000 | 483985 |
| Bradley Greer | San Francisco | 223500 | 19380 | 333085 | 56800 | 808075 |
- Area Chart
- Line Chart
- Bar Chart
- Column Chart
- Bubble Chart
To help decide which best suits your needs, each of the following is looked at in detail below Present your data in an Area Chart! Area charts are much like line charts, but they display different colors in the areas below the lines. This colorful and visual display distinguishes the data more clearly.
Line Chart The line chart is represented by a series of datapoints connected with a straight line. Line charts are most often used to visualize changes in the data over time or demonstrate trends. Pie Chart A pie chart shows data in terms of proportions of a whole. The ‘pie’ is divided into segments that represent this proportion. This is done by dividing the angles at the centre. It is most useful where one or two results dominate the findings. Also it can represent data expressed as actual numbers or percentages. Do not use where there are a large number of categories, or where each has a small, fairly equal share, as this can be unclear. Bar Chart Create a bar chart and give it a brand-new, appealing look. Much like a column chart, a bar chart is useful for comparing data points in one or more data series. Consider using a bar chart when you have one or more data series that you want to plot or you want to compare the data for numerous categories. Column Chart A column chart is a vertical bar chart and it is the most common type of diagram, and is frequently used. Column chart is particularly useful when one or two categories ‘dominate’ results. It can be very clear and easy to read. Most people understand what is presented without having to have detailed statistical knowledge. It can represent data expressed as actual numbers, percentages and frequencies. Bubble Chart A bubble chart is a variation of a scatter chart in which the data points are replaced with bubbles, and an additional dimension of the data is represented in the size of the bubbles. Bubble chart does not use a category axis — both horizontal and vertical axes are value axes. In addition to the x values and y values that are plotted in a scatter chart, a bubble chart plots x values, y values, and z (size) values. Bubble charts are often used to present financial data. Different bubble sizes are useful to visually emphasize specific values. Failed to find diagram 22. WordPress Data Table Charts and Graphs plugin is a powerful tool to create, manage and embed interactive charts into your WordPress posts and pages. Check the other features of WordPress Data Tables Generator