WordPress Data Table Plugin: Transform Your WordPress Site
WordPress Data Table
We all struggle with presenting complex data in an organized and visually appealing manner.
It’s super important, so finding an effective solution is crucial.
One tool that can help you master this challenge is a data table plugin.
In this article, we’ll explore six real-world applications for the very versatile Data Table Generator by Supsystic, and we’ll show you how to supercharge your data-driven endeavors.
What is a WordPress Data Table Plugin?
A WordPress data table plugin is a tool for creating and displaying interactive tables on your website.
It’s very similar to a spreadsheet.
The tables the plugin tool generates can be used to present various types of data, such as
- financial information,
- product comparisons,
- statistical data,
- project milestones,
- event details, and
- inventory levels.
All in a structured and visually appealing format.
Plus, these tables can also be made to be interactive, which allows your visitors to engage with and get more value from your website.
With the right plugin, you can customize your tables to suit your needs and enhance the user experience on your site.
Why Choose Data Table Generator by Supsystic?
Data Table Generator by Supsystic stands out as a robust and user-friendly plugin that offers a wide range of features to help you create and manage data tables with ease.
Whether you’re a seasoned professional or just starting, this plugin is designed to meet your needs and help you succeed in your data-driven endeavors.

1. Financial Analysis: Crunch the Numbers with Ease
You’ll recall that our Data Table Generator by Supsystic is like a spreadsheet.
Most of us use spreadsheets to manage and display all kinds of financial data. The major challenge is to transform a boring set of raw data (our financial information) from an ocean of grey numbers into a simple, clear, and aesthetically pleasing message.
We want our numbers to tell a story.
Typical applications for using a Data Table in the financial area might include:
- Stock Market Updates:
- Scenario: Financial news websites or investment platforms displaying live stock prices.
- Details: Data tables are crucial for listing stock symbols, current prices, percentage changes, and daily highs/lows. This enables investors to track market trends and make timely investment decisions based on the data presented. In this application, the information is simply being displayed – there’s no requirement for interaction.
- Loan Comparisons:
- Scenario: Banking and Lending websites offering various loan options.
- Details: Tables on these websites might compare different loan products with information on interest rates, loan terms, monthly payments, and the total cost of the loan. This format helps potential borrowers to compare their options side-by-side and choose the one that best fits their financial needs. However, an educational site may take it further and offer the capability for visitors to interact. A user might enter a different interest rate, or change the frequency of loan payments – which would be recalculated and reflected on a graph showing the revised loan performance. This interactivity will help users understand the impact of various inputs and help them make better choices when setting up a potential loan.
- Currency Exchange Rates:
- Scenario: Financial websites or travel platforms providing currency conversion rates.
- Details: Data tables display current exchange rates for multiple currencies, allowing users to quickly calculate the cost of conversions for travel or investment purposes. Such tables often include tools for sorting by currency or value to aid in easy comparisons.
- Investment Fund Performance:
- Scenario: Investment fund managers or financial advisors showcasing various fund performances.
- Details: Tables might list different investment funds with data on annual returns, risk ratings, fund size, and manager information. Investors can use these tables to assess and compare the performance and suitability of different funds for their portfolios.
- Budget and Expense Tracking:
- Scenario: Corporate or personal finance management applications.
- Details: Data tables help users manage and visualize budgets and expenses, breaking down costs by categories such as utilities, groceries, and entertainment. This detailed view assists in monitoring spending patterns and making informed financial decisions.
You can start with an empty table and add data as you go, or you can import your data from an external spreadsheet. With the data in the table, you have a range of display tools to “tell your story”.
This key task is the one that makes a difference. It’s vital to use presentation tools like graphs and charts to convey the message you want highlighted. With these tools, you can demonstrate trends, illustrate market share, or demonstrate a fundamental shift in a pattern.
Or you can proudly highlight that everything is on track – exactly as it was forecast (wouldn’t that be nice!).
If this is something that would help your site, Data Table Generator by Supsystic has a host of customizable table options and easy-to-use features so you can convey the message you want quickly and easily. Check out the “how to …” videos at the bottom of this article for more information.

2. Product Comparison and Pricing Tables: Simplify Complex Comparisons
Creating product comparison and pricing tables can be a daunting task, especially if you have a wide range of products or services to compare. However, with Data Table Generator by Supsystic, you can simplify this process and create visually appealing tables that showcase your products or services effectively. By presenting information in a clear and organized manner, you can help your customers make informed decisions and improve their overall shopping experience.
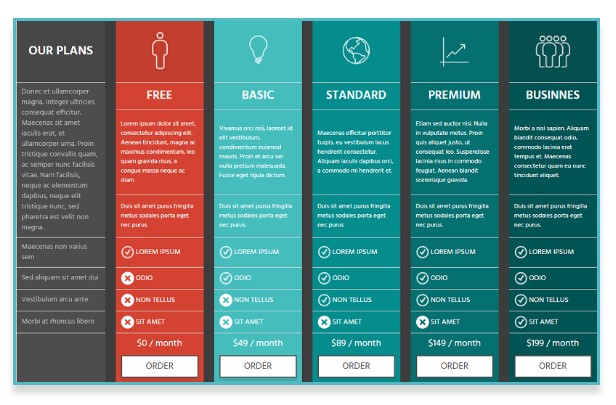
Creating Comparison Table or Pricing table using Supsystic’s WordPress data table plugin, just enter the data for each row and column in your table. For a comparison table, you might have columns such as “Features,” “Product A,” “Product B,” etc., and rows for each feature you want to compare.
Typical applications for using a Data Table in the comparison table and pricing table:
E-commerce Product Comparison
Scenario:
An online electronics retailer wants to help customers compare different laptops based on their specifications, features, and prices.
Details:
- Specifications: Columns include key specifications such as processor type, RAM, storage capacity, screen size, and battery life.
- Features: Additional columns highlight unique features of each laptop, such as touchscreen capability, graphics card, and operating system.
- Price: Each row displays the price of the laptop, allowing customers to compare prices across different models.
- Availability: Optional column indicating the availability of each laptop, whether in stock or on backorder.
- Customization: The retailer can customize the table layout and design to match their website’s branding and user interface.
Software Subscription Pricing
Scenario:
A software company offers multiple subscription plans for its project management tool and wants to help potential customers compare the features and pricing of each plan.
Details:
- Plan Name: Columns include the name of each subscription plan, such as Basic, Pro, and Enterprise.
- Features: Rows list the features included in each plan, such as number of users, storage capacity, project tracking, and customer support.
- Price: Each plan’s pricing is displayed in a separate column, showing monthly or annual subscription fees.
- Additional Options: Optional columns may include add-on features or services available for an additional cost, such as priority support or training sessions.
- Discounts: The company may highlight any discounts or promotions available for certain plans, encouraging customers to choose higher-tier subscriptions.
- Clear Call to Action: Each plan may be accompanied by a prominent “Subscribe Now” button, directing customers to the checkout page to complete their purchase.
By utilizing data tables in these scenarios, businesses can provide valuable information to their customers in a clear, organized format, facilitating informed decision-making and enhancing the overall user experience.
3. Statistical Analysis: Visualize Data Beautifully
Visualizing statistical data is essential for interpreting complex datasets and drawing meaningful conclusions. Data Table Generator by Supsystic offers a range of features to help you visualize your data beautifully. Whether you’re creating charts, graphs, or other visual elements, this plugin can help you present your data in a way that is easy to understand and analyze.
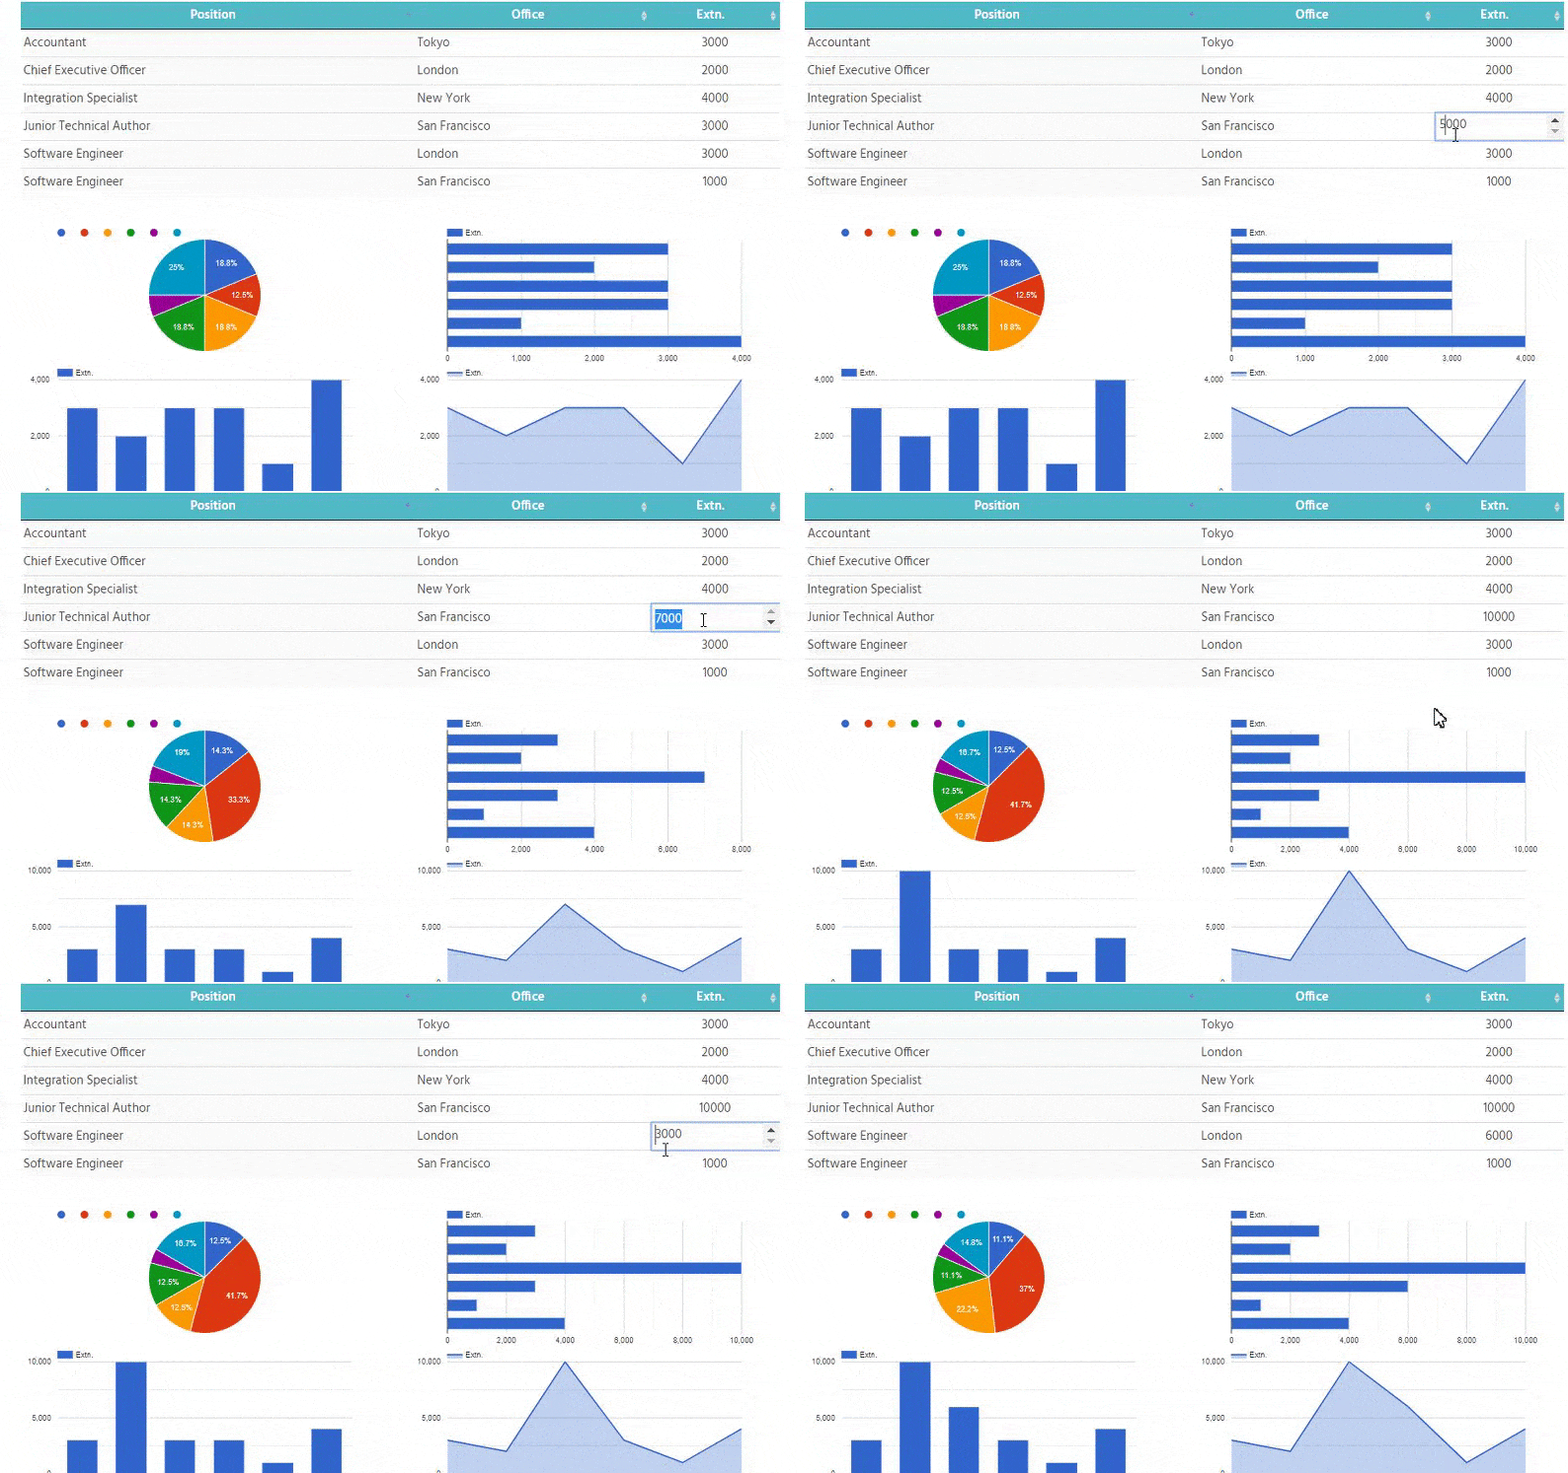
To create Statistical Analysis using Supsystic’s WordPress data table plugin, just Click on the “Add Column” button to add columns to your table. Enter the column name and select the column type (e.g., text, number, date). Repeat this step for each column you want to add. For a statistical analysis, you need to have columns for variables such as “Value,” “Mean,” “Median,” “Standard Deviation,” etc., and rows for each data point.
Typical applications for using a Data Table in the Statistical Analysis:
Market Research Data Analysis
Scenario:
A market research firm collects data on consumer preferences for different smartphone brands and models.
Details:
- Data Variables: Columns represent various data variables, such as brand, model, price, screen size, camera resolution, battery capacity, and customer ratings.
- Sample Size: Each row corresponds to a respondent in the survey, providing their demographic information and responses to specific questions.
- Descriptive Statistics: The data table includes descriptive statistics such as mean, median, mode, standard deviation, and range for numerical variables like price and screen size.
- Correlation Analysis: Additional columns may display correlation coefficients between pairs of variables, indicating the strength and direction of relationships.
- Visualization Tools: The market research firm can use the data table to create visualizations such as histograms, scatter plots, and box plots to further analyze and interpret the data.
By organizing the data in a structured format, the firm can conduct comprehensive statistical analysis to uncover insights into consumer preferences and trends in the smartphone market.
4. Project Management: Keep Your Projects on Track
Managing project milestones, tasks, and timelines can be challenging, especially when dealing with multiple projects simultaneously. Data Table Generator by Supsystic can help you keep track of all aspects of your projects in an organized manner. By creating tables that outline project details, you can ensure that everything runs smoothly and that deadlines are met.
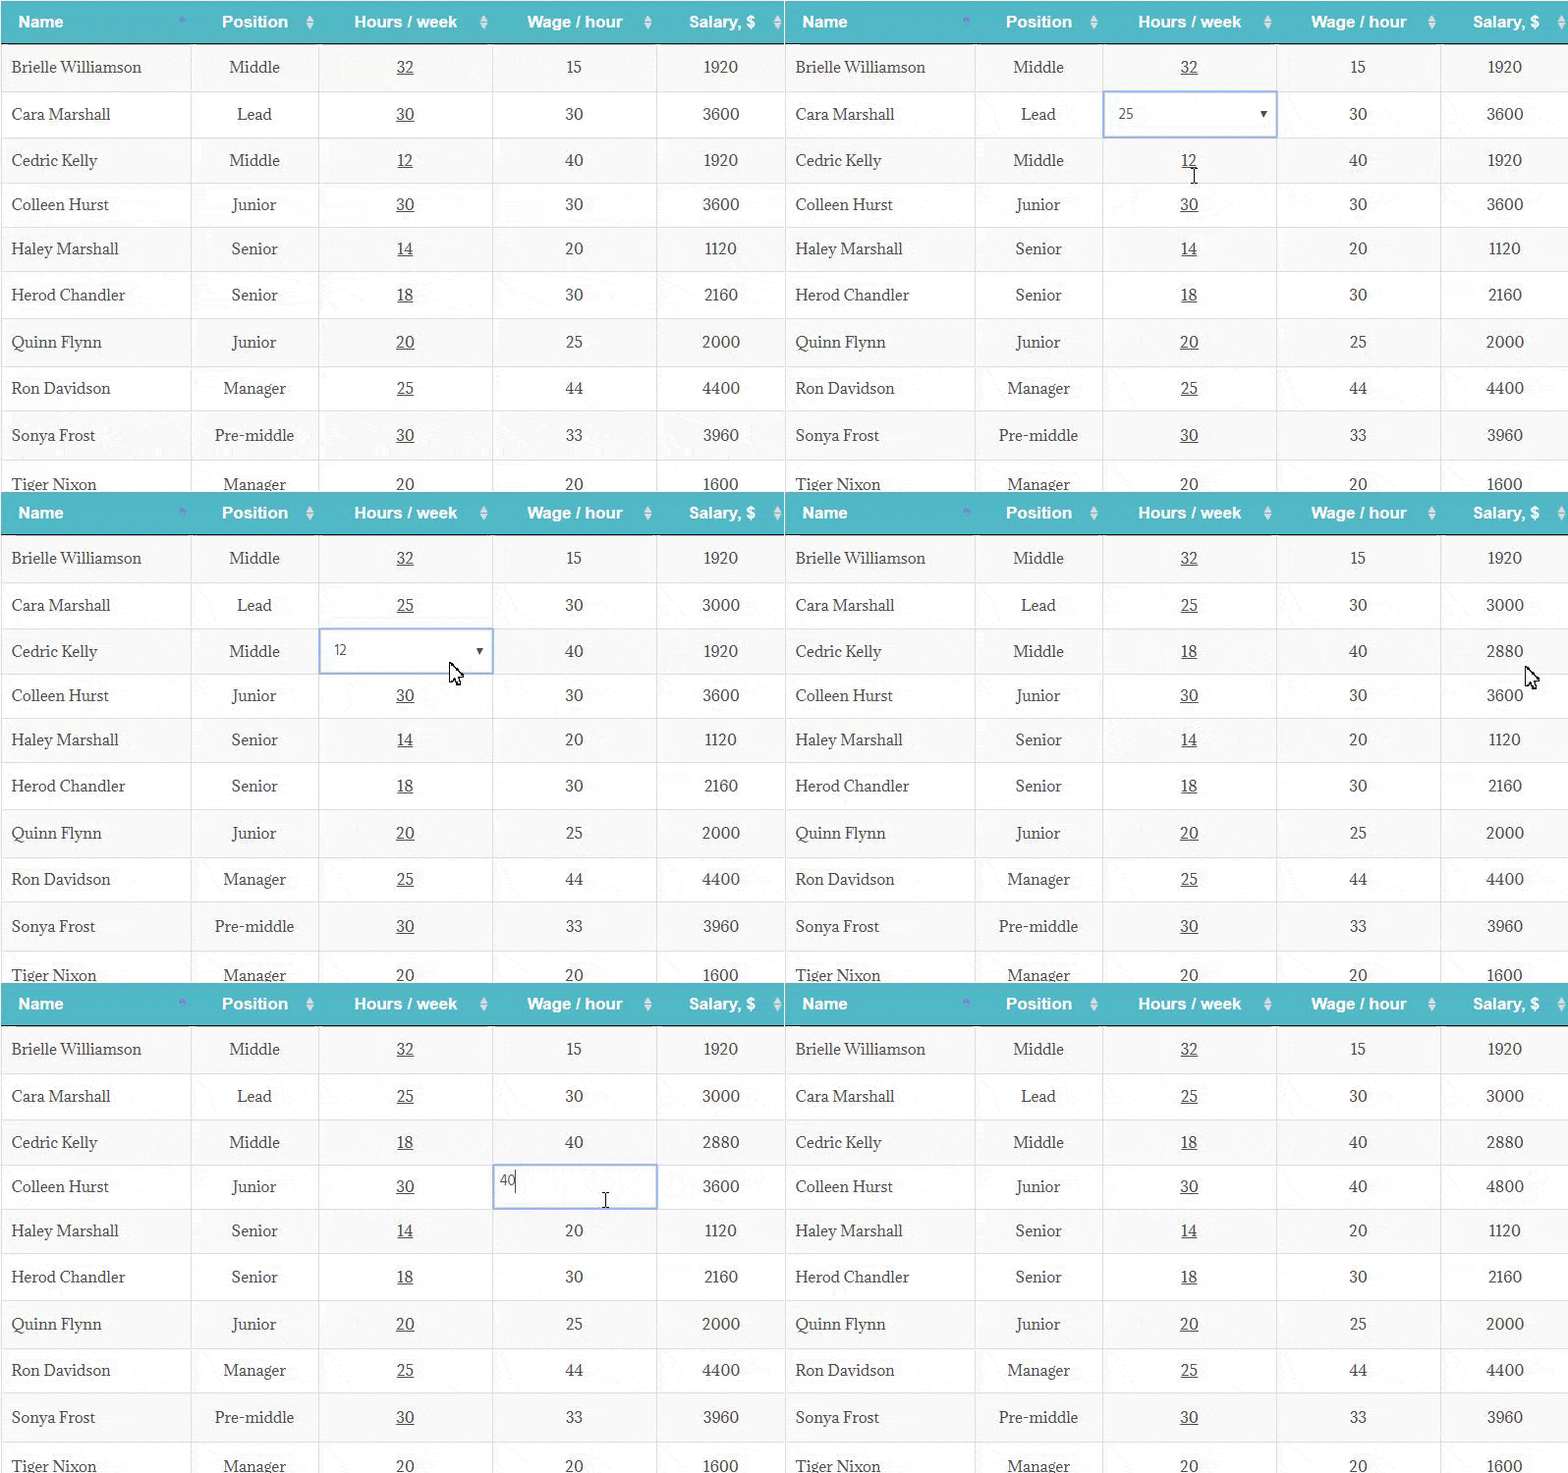
Creating Project Management Table using Supsystic’s Data Table Plugin is easy! Just enter the data for each row and column in your table. For example, you can enter the task name, deadline, assigned team member, and status (e.g., not started, in progress, completed) for each task in your project.
5. Event Planning: Manage Events Effortlessly
Planning events involves managing a wide range of details, from guest lists to schedules to logistics. Data Table Generator by Supsystic can help you manage all aspects of event planning with ease. By creating tables that organize event details, you can ensure that your event runs smoothly from start to finish.
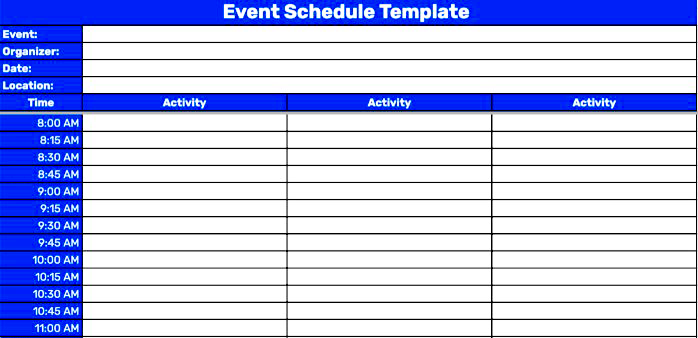
You just need to enter the data for each row and column in your table. For example, you can enter the event date, time, location, guest names, RSVP status, and any other relevant details for your event. Enable sorting and filtering options for your table to make it easier to manage your event. Users can sort guest names alphabetically or filter guests by RSVP status, for example.
Guest List Management
Scenario:
A corporate event planner needs to manage the guest list for an upcoming conference.
Details:
- Guest Information: Columns include details such as guest name, affiliation, contact information, RSVP status, dietary preferences, and seating arrangements.
- Invitation Status: Each row represents an invited guest, with columns indicating whether the invitation has been sent, RSVP received, and attendance confirmed.
- Meal Preferences: Additional columns may specify meal preferences or restrictions for each guest, ensuring catering arrangements accommodate dietary needs.
- Seating Assignments: The event planner can use the data table to assign seating arrangements for guests, grouping attendees by organization or seating preferences.
- Communication Log: The table may include a section to log communication with guests, including email exchanges, phone calls, and follow-up reminders.
By utilizing a data table for guest list management, the event planner can efficiently track RSVPs, communicate with attendees, and ensure a seamless experience for guests at the event.
6. Inventory Management: Streamline Your Inventory Processes
Monitoring inventory levels and tracking stock movements are essential aspects of inventory management. Data Table Generator by Supsystic can help you streamline these processes by creating tables that track inventory levels, stock movements, and ordering processes. By having all this information in one place, you can efficiently manage your inventory and ensure that you always have the right products on hand.

Just enter the data for each row and column in your table. For example, you can enter the product name, description, SKU number, current stock level, reorder point, and any other relevant details for each product in your inventory and you are good to go!
Application: Product Inventory Tracking
Scenario:
A retail store needs to keep track of its inventory of clothing items.
Details:
- Product Information: Columns include details such as product name, SKU (stock-keeping unit), description, category, size, color, and price.
- Quantity on Hand: Each row represents a specific product variant, with columns indicating the quantity of each item currently in stock.
- Reorder Points: Additional columns may specify reorder points and reorder quantities for each product, triggering alerts when inventory levels fall below a certain threshold.
- Supplier Information: The data table can include supplier details, such as supplier name, contact information, lead times, and pricing agreements.
- Sales History: Optionally, the table may track sales history for each product, including dates of sales, quantities sold, and revenue generated.
- Inventory Status: Visual indicators or conditional formatting can highlight low-stock items or items nearing their expiration dates, facilitating proactive inventory management.
By utilizing a data table for inventory tracking, the retail store can maintain accurate records of product availability, streamline reordering processes, and optimize inventory levels to meet customer demand effectively.
Conclusion: Unlocking the Potential of Your Data with Data Table Generator by Supsystic
In conclusion, a WordPress data table plugin is a valuable tool that can help you organize and present data in a way that is visually appealing and easy to understand. Data Table Generator by Supsystic stands out as a powerful plugin that offers a wide range of features to help you leverage the power of data tables on your WordPress site. Whether you’re looking to track your finances, create product comparison tables, visualize statistical data, manage projects, plan events, or streamline inventory processes, this plugin has you covered.
Ready to supercharge your data-driven endeavors?
Explore the endless possibilities with Data Table Generator by Supsystic today and take your projects to the next level!
To learn more about using data tables effectively, visit our website or contact our support team today. Happy tabling!
About the Author: Colin Ferguson
Colin is the General Manager at Supsystic and has been at the helm since 2019. Having spent 40+ years in small businesses himself, he understands the trials and tribulations that go with the territory. He was a pioneer in adopting lead magnet strategies and digital marketing as early as 2000 and has been a strong advocate for small businesses adopting a digital presence.
Now, his passion for helping small and medium businesses harness the power of the internet continues – so much so that it’s brought him out of retirement and back into the game.
In addition to captaining the Supsystic ship, Colin has various other online projects that help him stay on top of the latest developments.
How:
This article was lovingly written by a human (with a little help from AI). Sources are referenced with links – and the balance is the observations and opinions of the author.
Why:
There is widespread concern by webmasters over the potential SEO and traffic problems resulting from the recent Google policy and algorithm changes. The article reviews those changes and considers responses that help Webmasters protect their websites.
WordPress Data Table Plugin FAQ
What is a WordPress data table plugin?
A WordPress data table plugin is a tool that allows you to easily create tables and display data in a structured format on your WordPress website. These plugins are designed to simplify the process of building and managing tables without needing extensive coding knowledge.
How can a table plugin benefit my WordPress site?
A table plugin can enhance the visual appeal and functionality of your WordPress site by providing an efficient way to organize and present data. You can use it to create comparison tables, pricing tables, product tables, and more to improve user experience and engagement.
What are the features of the best WordPress table plugins?
The best WordPress table plugins typically offer a user-friendly interface, customizable design options, support for different data sources, responsive layouts, charts integration, import data functionality, and the ability to display tables and charts on various pages of your WordPress website.
How can I create a data table with a WordPress data table plugin?
Creating a data table with a WordPress data table plugin is usually straightforward. You can import data from different sources or manually input it, customize the table’s appearance and functionality using the plugin’s settings, and easily embed the finalized table on your WordPress site.
What is WPDataTables plugin?
WPDataTables is a popular WordPress table builder plugin that allows you to create responsive and interactive data tables and charts with ease. It offers advanced features such as data management, charts integration, and support for large datasets.

