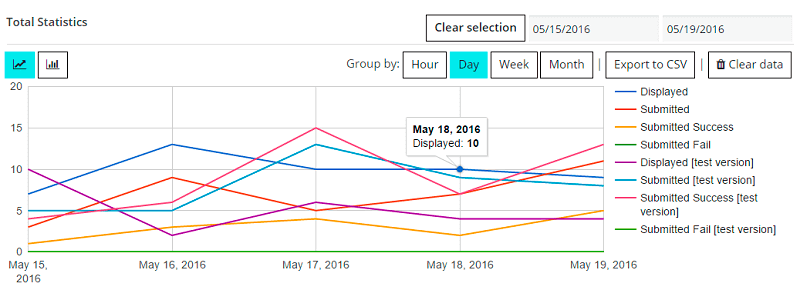
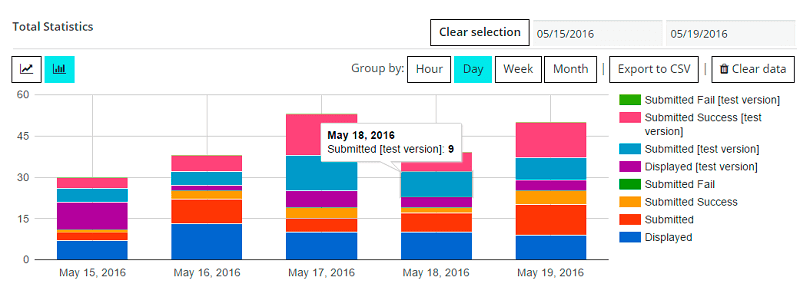
If you like to keep everything under control – the Statistics page is maximum useful for you. Even if it’s not so important, you can always check it, just to see what’s very effective and which form is less.
On the data graphs you will see four kinds of info:
- Displayed – the number of Contact Form views
- Submitted – the quantity of attempts to submit the data
- Submitted Success – successfully submitted data nubmer
- Submitted Fail – unsuccessful submitted data efforts
This data is displayed on the Statistics page in two kinds of graph. You can see it like a bar or line chart, but both of them are very easy and understandable, colorful and clear.
Choose the one: a line chart


Statistics functions of Contact Form plugin by Supsystic allow you to perform the following actions with graph:
- Output data in the form of line graph or bar graph
- Select any specific time frame for viewing statistics (for all the time by default)
- Grouped data to periods: hour, day, week or month for more compact output
- Export statistics to CSV file
- Clear Data – Remove all statistics at any time you need