WordPress Data Table Charts and Graphs plugin is a powerful tool to create, manage and embed interactive charts into your WordPress posts and pages.
In order to create Google Charts and Diagrams to the WordPress you need:
- Select the required data in the table and click on button “Add diagram”

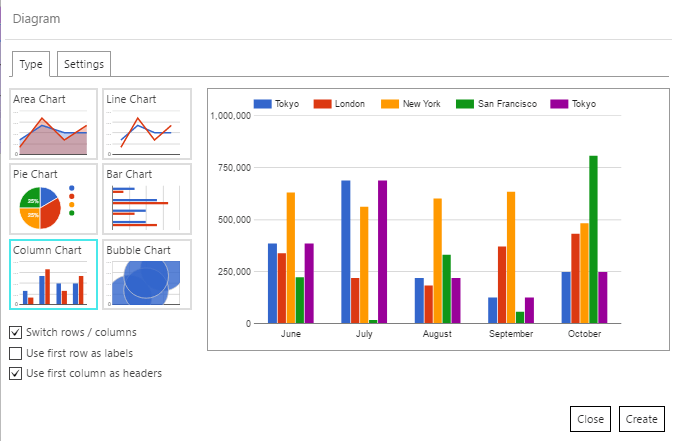
- In “Diagram” popup window choose type of diagram, customize it and click “Create” button.
 There are six types of diagrams to choose from:
- Area Chart
- Line Chart
- Pie Chart
- Bar Chart
- Column Chart
- Bubble Chart
You can also change such settings here:
- Switch rows / columns
- Use first row as headers
- Use first column as labels
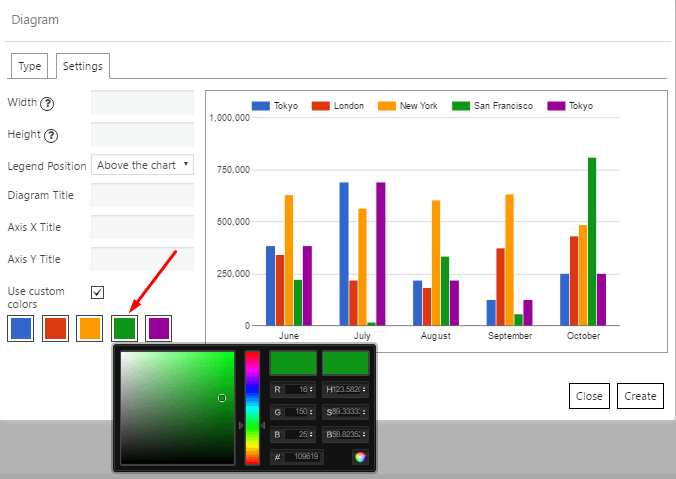
On the Settings tab you can customize next parameters:
- Width and Height of the diagram – set the value in px or %, or leave this field empty to use default width value
- Legend Position – choose between:
- No legend
- Above the chart
- Below the chart
- Left of the chart
- Right of the chart
- Diagram Title – type a name of the diagram
- Axis X and Y Title – type a name of X-Y axis
- Use custom colors – change default colors of diagram items by choosing them in color picker

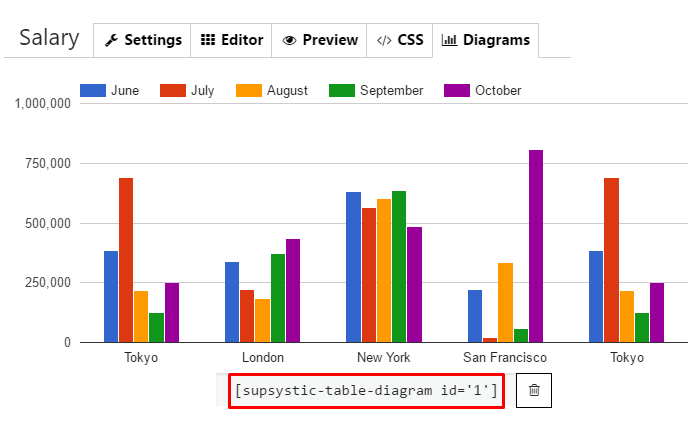
- To use diagram on your site – copy shortcode under the diagram on Diagrams tab and paste it into the page or post.

Check out examples of all types of diagrams here.
Here is a tutorial How to create Google Charts with Data Table WordPress plugin:
 There are six types of diagrams to choose from:
