With the Database Source Pro feature, you have the ability to display not only the table from the database on the front-end, but also create, manage and embed interactive charts and diagrams!
To build the Data Source Graphs, you can get data from any table of WP database or External databases, or select the data, making the Database Query Source.
How to create first Data Source Graphs:
- To start with, you need to create Data Table based on database you require.
- Move to Data Tables Generator -> Create a Table and open Source Tab. Than select the necessary table as a source or make the SQL Query and get the base for Graph. Our tutorial will help to make these thirst steps.
- When you made all necessary setting, click Preview and Table will be created and displayed in this tab and you can make sure if everything correct and looks properly.
- Now it is high time to specify a range for diagram.
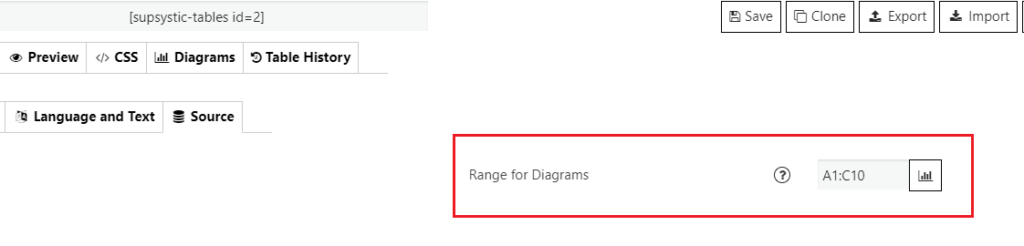
Set the range in the format A1:C10 as in Excel, where the letter is the column number in alphabetical order, the digit is the row number. After this, press the icon and select the type of Graph.
- Make a settings in Diagram Tab and press the Create button.
- Number of created charts is unlimited and they will be saved in the Diagrams tab. There you have the option to change the Range and re-save Graph.
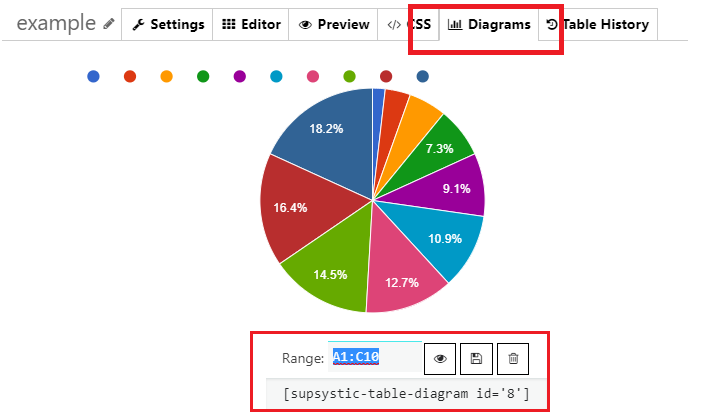
- Using the short-code, paste it to your site content, then Data Tables Generator plugin will display the Graph you created on appropriate post/page.