If you have a lot of data, the chats are the great way to represent data in the best way.
It’s really informative way to represent data and we know, that every point has a value.
Now, Data Table Plugin comes with an ability to set style for chart points.
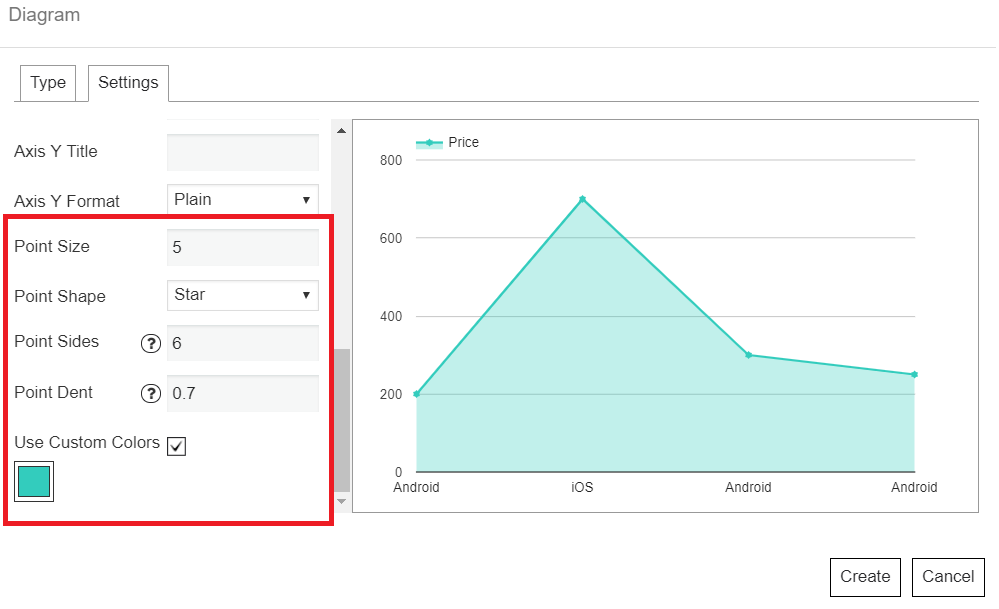
Using Area and Line chart, you can move to the Settings tab and take advantage of the additional settings for points style:
- Size – set the the size for point.
- Shape – choose the shape of the point.
- Sides – set the number of sides which will be have points of chart in star or polygon shape. Please, use values greater than 2.
- Dent – set how concave the star will be if you have chosen the star shape of chart points. Please, use values from 0.1 to 1.

We’re sure you’ve already tried our Charts and Diagrams features – easy to create, so practical and now even more stylish for representing data!