The legend helps users better understand a chart by identifying what each series (data set) represents. Data Tables Generator provides a new option for charts and graphs – .
So, basic chart legend setup includes creating the object, specifying the legend positioning and toggling.
In order to add this function to your diagram you need:
- Select the required data in the table and click on the button “Add diagram” to create a diagram.
- In “Diagram” popup window choose the type of diagram, customize it and click the “Create” button. Toggling option is compatible with all types of diagrams except Bubble:
- Area Chart
- Line Chart
- Pie Chart
- Bar Chart
- Column Chart
- 3d Charts – Bar, Donut, Pie, Pyramid
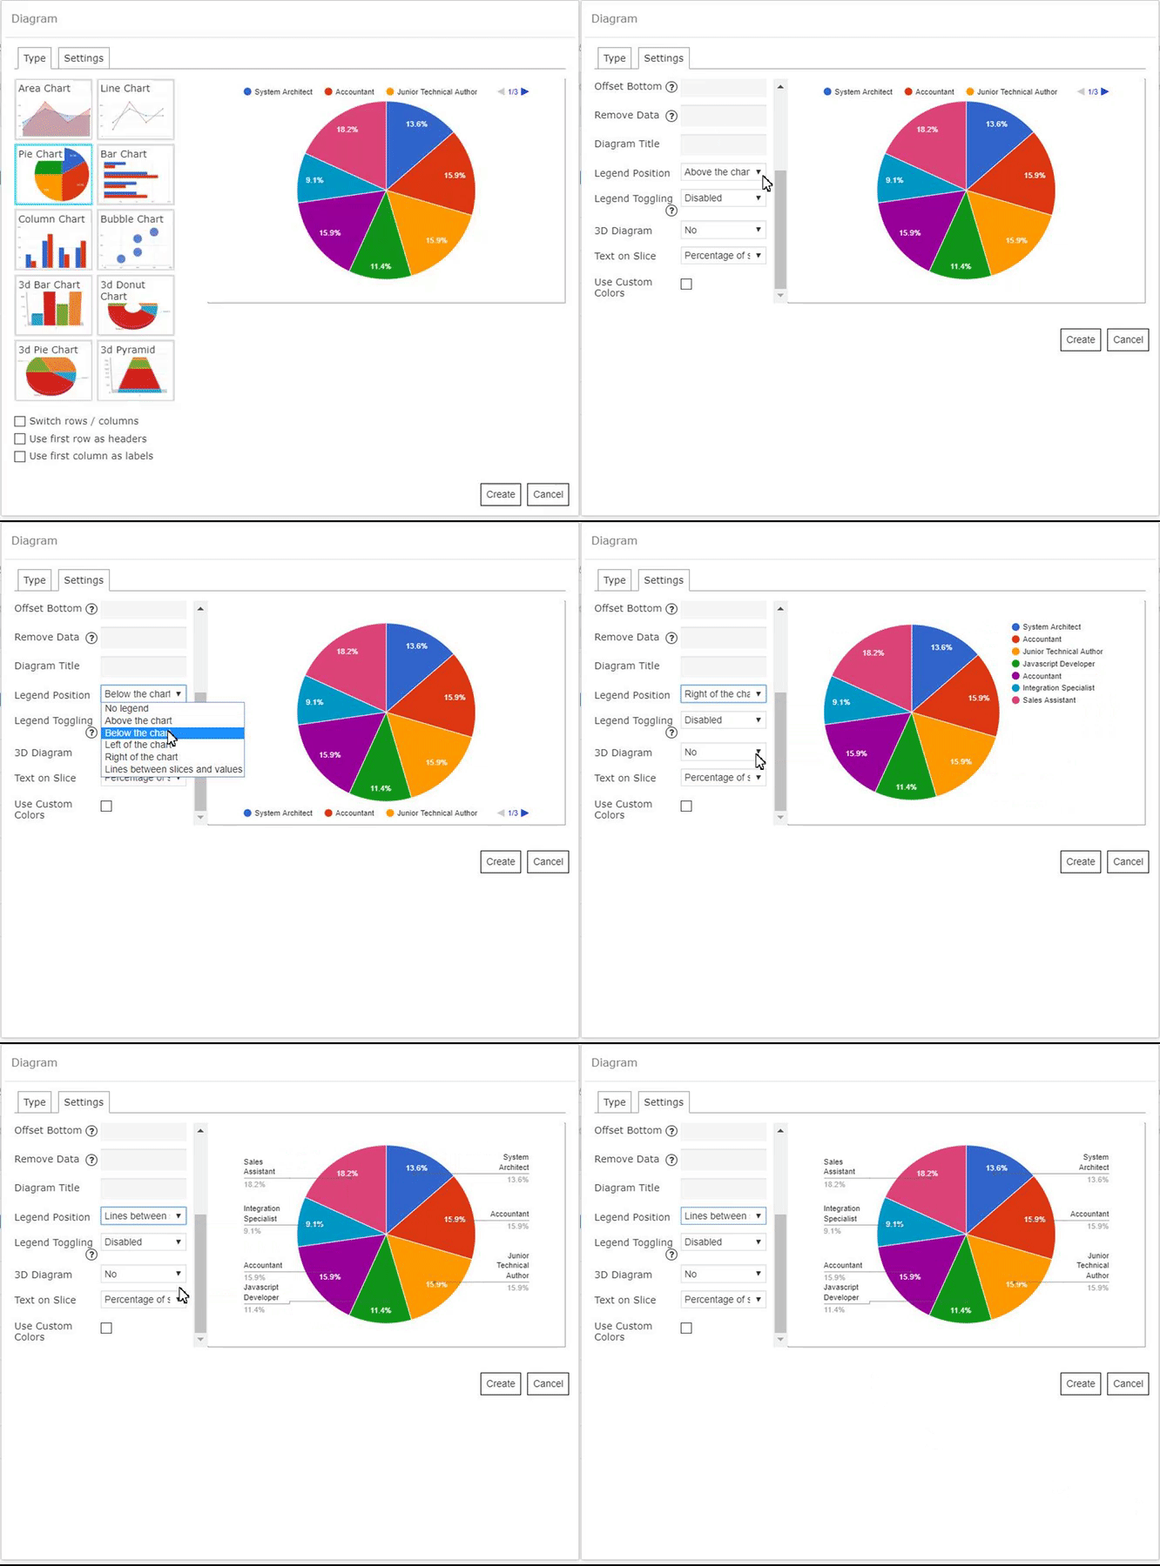
Move to the Settings tab and make settings for a table legend:
Legend Position – choose a position: 
- No legend
- Above the chart
- Below the chart
- Left of the chart
- Right of the chart
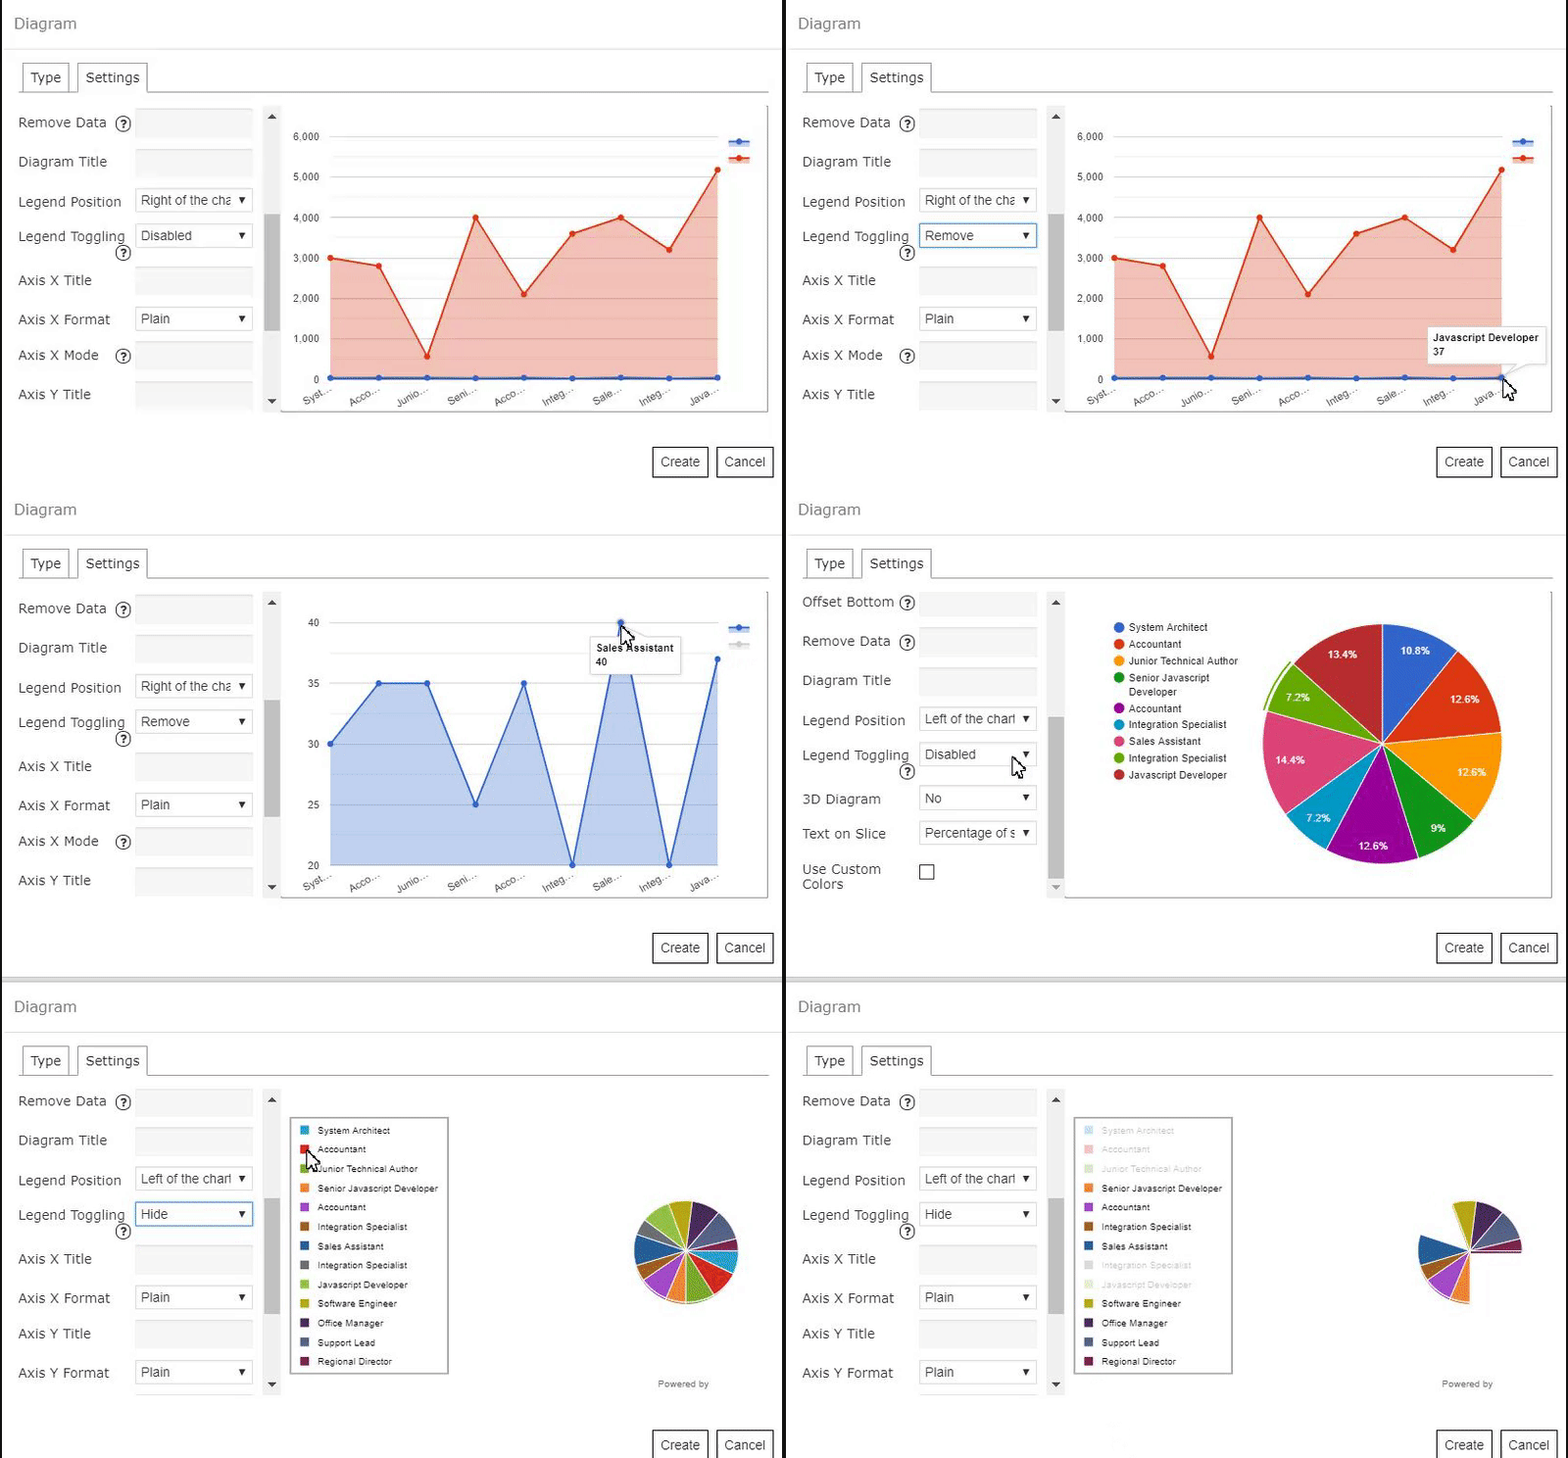
Legend Toggling – you can set what happens when the user clicks a legend item/marker:
- Remove: repaints the chart without the selected series
- Disabled: disables legend toggling.
- Hide: Hides the selected node

Here are the Examples of Legend toggling:
- Hide:
- Remove