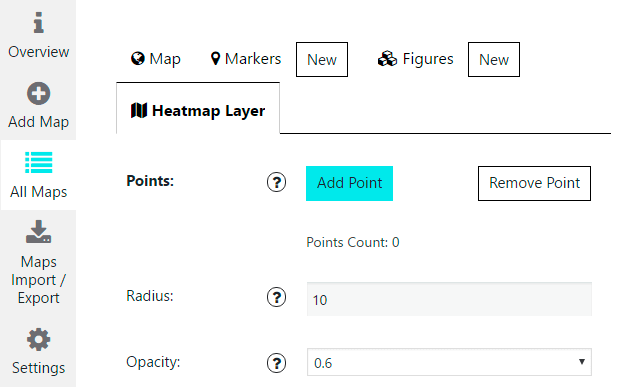
Heatmap Layer (PRO feature) is a visualization used to depict the intensity of data at geographical points. Areas of higher intensity will be colored red, and areas of lower intensity will appear green.
Heatmap using points of layer to calculate and display the relative density of the points on the map as a smoothly varying set of colors, from cold (low density) to warm (high density).
Heatmap layer can be used for mapping the locations of point objects. They are useful if you have too many points which need to place on the map, or many points which are too close to each other, making it difficult to distinction. They are well suited for the displaying of layers with a lot of point objects.
Right after you have created your map, you can begin to compose heat layer on it. On the Heatmap Layer Tab you can find next settings of this feature:
-
- Add Points – draw each point by click on map. To remove points you need to activate “Remove Points” button and delete necessary point by click on it or just click on “Delete Heatmap Layer” button to remove all Heatmap Layer points.
- Radius – the radius of influence for each data point, in pixels.
- Opacity – the transparency of the heatmap, expressed as a number between 0 and 1.

Under map live preview you can see the shortcode. Copy and paste the shortcode into your post or page text editor and Google Maps Easy by Supsystic plugin will automatically create the map on your page using the settings you choose above.