A league table looks simple until you have to keep one. Every result changes three numbers, the points have to be counted, the clubs have to be re-ordered, and when two teams finish level you need a fair way to separate them. Doing that by hand after every matchday is how mistakes end up on a club website.
This guide shows how to create a league table in WordPress that does the work for you. Formulas count goal difference and points, the standings sort themselves by points, then goal difference, then goals scored, the positions number themselves, and the table stays readable on a phone. Everything below is built with the free Data Tables Generator plugin, and it takes about fifteen minutes.
What a good league table needs
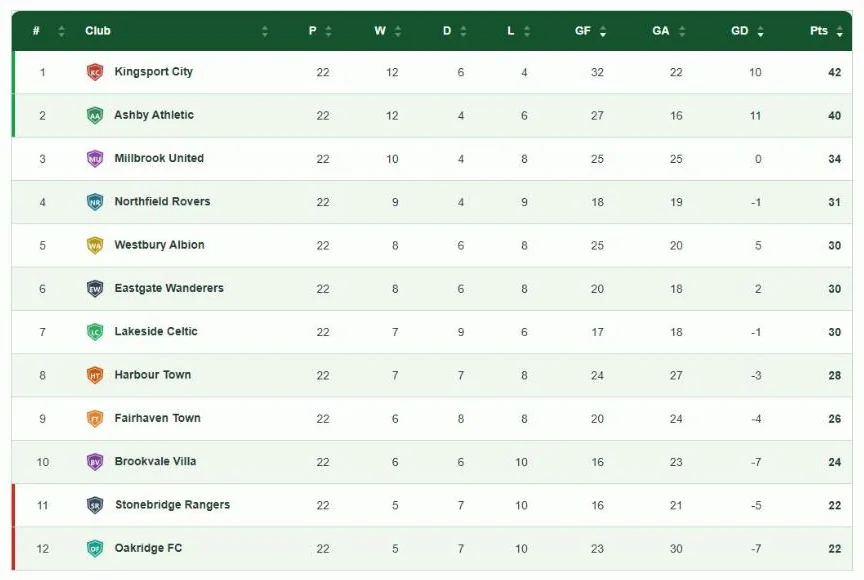
Before you open the editor, it helps to know what the table has to do. A football-style standings table usually has these columns:
- # – the position, which should follow the order of the table, not the order you typed the clubs in.
- Club – the name, ideally with a small club badge.
- P, W, D, L – played, won, drawn and lost.
- GF, GA, GD – goals for, goals against and goal difference.
- Pts – points: 3 for a win and 1 for a draw in most football leagues.
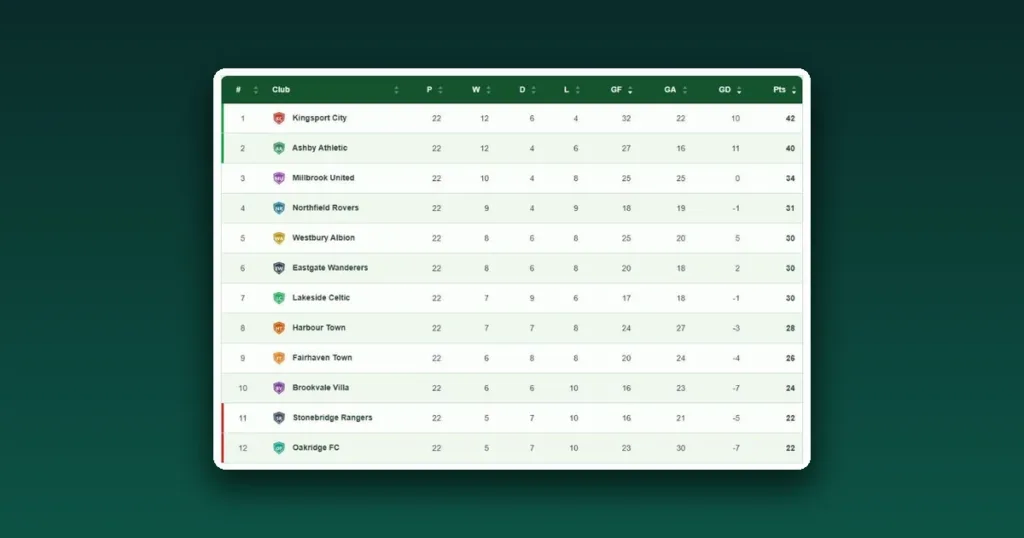
Then come the rules. The table is ordered by points. When clubs finish level on points, many leagues, including the Premier League, look at goal difference first and goals scored second. Our demo league has exactly that situation: three clubs on 30 points, separated only by goal difference. You will see below how the table handles it without any manual work.
Step 1. Start from the League standings template
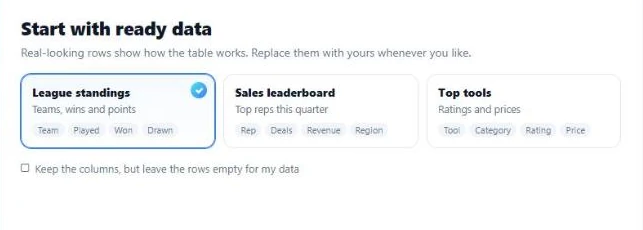
Install and activate Data Tables Generator, then open Data Tables by Supsystic → Add new table. The table wizard asks what you want to build. Choose Leaderboard or ranking.
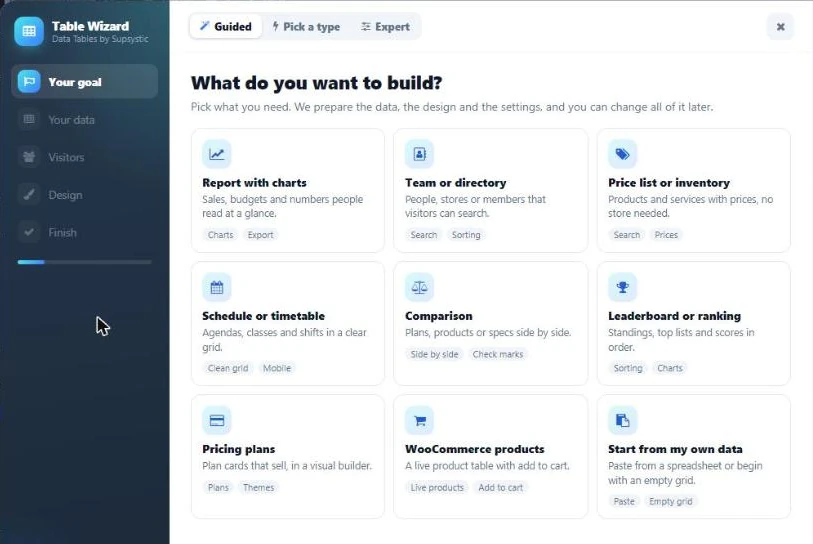
On the next step pick the League standings sample. It already has Team, Played, Won, Drawn, Lost and Points columns, and the live preview on the right shows how the table will look before anything is saved.
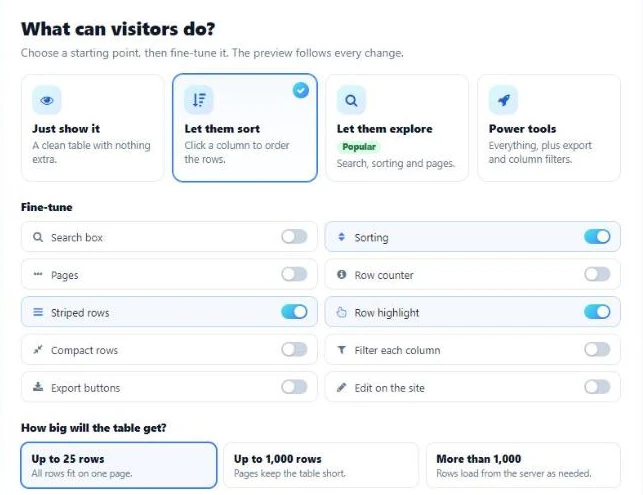
On the Visitors step keep Let them sort, so fans can click a column header to sort by goals or wins. For a league of up to 25 clubs leave the size at Up to 25 rows: every club stays on one page, with no pagination.
Pick a palette (the demo uses Botanical, a pitch-green look), give the table a name and click Create my table. The wizard gives you the shortcode right away.

Step 2. Add your clubs and results
The editor works like Excel or Google Sheets. Replace the sample rows with your clubs, or copy the range from a spreadsheet and paste it into the first cell: the values land in the right cells. Add the columns you need with the Column button. The demo uses #, Club, P, W, D, L, GF, GA, GD, Pts.
Leave the first column empty: the plugin will number the positions for you in Step 5. Club order does not matter either, so you can keep the clubs in alphabetical order, which makes them easy to find when you enter results.
To show club badges, put an image in the club cell with the Insert Media button, or type the image tag yourself. Cells accept images, links and HTML, so a badge and a name can share one cell (how to insert images in a table).
Step 3. Let formulas count goal difference and points
You should never type goal difference or points by hand: that is where wrong tables come from. Type a formula once per row instead, exactly as you would in a spreadsheet. With the columns above, row 2 gets:
GD (column I):  =G2-H2
Pts (column J): =D2*3+E2
Copy the formulas down the rows, changing the row number. From now on, when you change a club’s wins, draws or goals, GD and Pts update immediately.
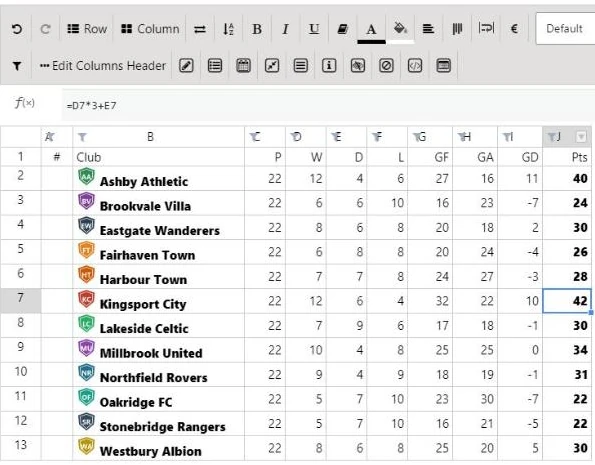
Formulas such as SUM, AVERAGE and IF are supported too, so you can adapt the points rules to your competition (see how to use formulas in tables and the list of supported formulas).
Step 4. Sort by points, then goal difference, then goals scored
A league table has to open in the right order, and it has to break ties the way your league does. Data Tables Generator does both with multiple column sorting:
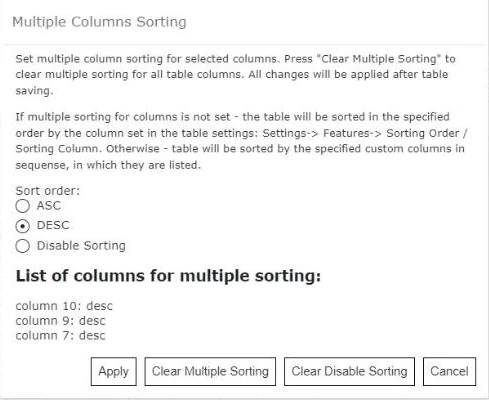
- In the editor, select a cell in the Pts column and click the Add Multiple Sorting button on the toolbar.
- Choose DESC and click Apply.
- Do the same for GD, then for GF.
- Save the table.
The dialog lists the rules in the order you added them. The table now sorts by points first, by goal difference when points are equal, and by goals scored when both are equal.
In the demo, Westbury Albion, Eastgate Wanderers and Lakeside Celtic all have 30 points. Their goal differences are +5, +2 and −1, so they finish 5th, 6th and 7th in that order, and nobody had to move a row.
Step 5. Number the positions automatically
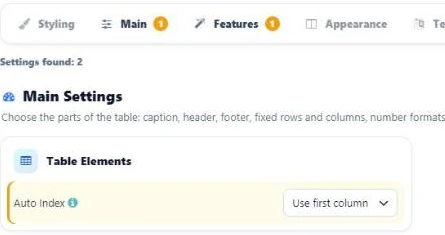
Typed position numbers go wrong the moment a club moves up. Let the plugin count instead: open Settings → Main and set Auto Index to Use first column. The empty first column now shows 1, 2, 3… in the order of the table, after every re-sort.
Step 6. Mark promotion and relegation zones
Readers scan a league table for the top and the bottom. Each table has its own CSS tab, so you can mark the zones without touching your theme (see how to use the CSS editor). Paste this, replacing 652 with your table ID:
/* Club badges sit next to the club name */
#supsystic-table-652 td img {
  display: inline-block !important;
  width: 24px;
  height: 24px;
  margin: 0 8px 0 0;
  vertical-align: middle;
}

/* Promotion zone: the top 2 clubs */
#supsystic-table-652 > tbody > tr:nth-child(-n+2 of tr:not(.child)) > td:first-child {
  box-shadow: inset 4px 0 0 #16a34a;
}

/* Relegation zone: the bottom 2 clubs */
#supsystic-table-652 > tbody > tr:nth-last-child(-n+2 of tr:not(.child)) > td:first-child {
  box-shadow: inset 4px 0 0 #dc2626;
}
The markers follow positions, not clubs: when a club drops into the bottom two, the red bar moves with the table. Change 2 to the number of promotion or relegation places in your league.
Step 7. Make the table work on phones
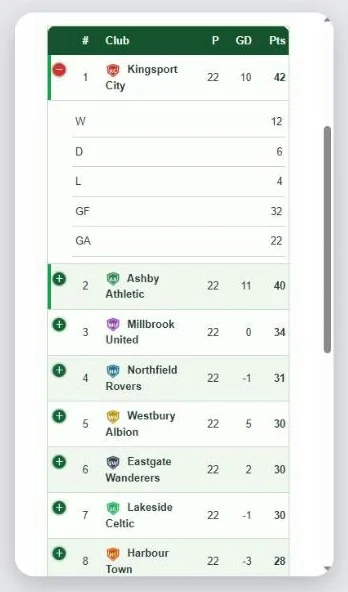
Most fans check the table on a phone, and ten columns do not fit on a 390-pixel screen. In Settings → Features set Responsive Mode to Column Hiding with Settings and click Open Settings. For the Mobile profile, list the columns that must stay visible. The demo keeps 1, 2, 3, 9, 10: position, club, played, goal difference and points.
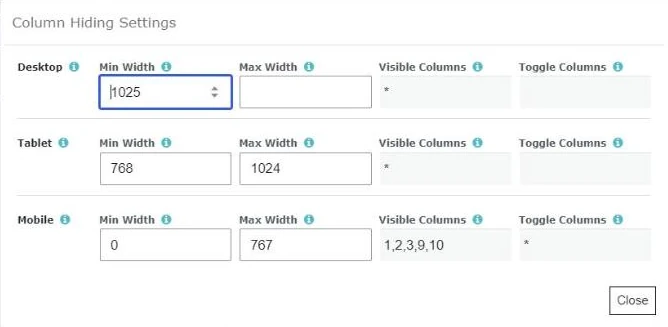
Everything else moves under a + button on each row, so W, D, L, GF and GA are still one tap away. If you also want tighter cells on phones, add this to the CSS tab:
@media (max-width: 600px) {
  #supsystic-table-652 { width: 100% !important; }
  #supsystic-table-652 th,
  #supsystic-table-652 td { padding: 8px 4px !important; font-size: 13px; }
  #supsystic-table-652 > thead > tr > th:first-child,
  #supsystic-table-652 > tbody > tr > td:first-child { padding-left: 30px !important; }
  #supsystic-table-652 thead .stb-classic-sort { display: none; }
  #supsystic-table-652 td img { width: 18px; height: 18px; margin-right: 5px; }
}
More about the responsive options: how to make a data table responsive.
Step 8. Publish the league table
Put the table on any page or post in the way that suits your site:
- the Data Tables by Supsystic block in the block editor;
- the Data Tables by Supsystic widget in Elementor;
- the shortcode, for example
[supsystic-tables id=652], in any other builder or in a widget area.
One table can appear on several pages, such as the home page and the fixtures page, and you still edit it in one place (how to add a table to your site).
Updating the table after every matchday
This is where the setup pays off. After a game, open the table, find the club’s row and change the numbers for played, won and goals. Goal difference and points recalculate, and when you save, the standings re-sort themselves on the site:
If several people look after the league, Data Tables Generator Pro takes the job further:
- Google Sheets auto-update (Pro): keep the results in a shared sheet and the table on your site updates on a schedule.
- Front-end editing (Pro): let a logged-in league secretary update scores right on the page, with no access to the WordPress dashboard needed.
- Conditional formatting (Pro): colour cells by value, for example a negative goal difference in red.
- Charts (Pro): turn the same rows into a points chart that updates with the table.
Other sports and points systems
Because points are a formula, the same table works for almost any competition. Change the formula in the Pts column:
- Ice hockey (3-2-1 system): 3 points for a regulation win, 2 for an overtime win, 1 for an overtime loss. With columns for each,
=C2*3+D2*2+E2. - Rugby union with bonus points: 4 for a win, 2 for a draw, plus bonus points in their own column.
=C2*4+D2*2+H2. - Basketball or esports: rank by win percentage with
=C2/B2and sort that column descending. - Quiz leagues, chess clubs, office competitions: sum the round scores with
=SUM(C2:J2).
Running several divisions? Build the first table, then use Clone to copy it with all formulas, sorting rules and CSS, and change only the clubs.
FAQ
Is this free?
Yes. Everything in Steps 1 to 8, including the wizard, formulas, multiple column sorting, Auto Index, the CSS tab, the responsive modes, the block and the Elementor widget, is in the free version of Data Tables Generator. Pro adds Google Sheets auto-update, front-end editing, conditional formatting and charts.
Can the league table update itself from match results?
The table recalculates and re-sorts itself every time you change the numbers. With Pro you can keep the results in Google Sheets and let the table update from the sheet on a schedule, or let the league secretary edit the scores on the page.
How do I break ties the way my league does?
Add one sorting rule per tie-breaker, in the order your league applies them. If your league uses a rule that is not a column yet, such as head-to-head points or a disciplinary score, add a column for it and add it as the last sorting rule.
Can I show club logos?
Yes. Cells accept images, so a badge and the club name fit in one cell. Use small square images of about 48 pixels and show them at 24 pixels for sharp results on high-resolution screens.
Will it work with my theme and page builder?
Yes. The table is added with a block, an Elementor widget or a shortcode, so it works in the block editor, Elementor, Divi, WPBakery and other builders. The colours come from the palette you pick in the wizard, and you can fine-tune them in the table settings.
Build your league table
Data Tables Generator is free on WordPress.org and is used on 19,000+ WordPress sites. Download it, start from the League standings template, and your table will keep its own order from the first matchday to the last.
Download Data Tables Generator free | See Pro plans | Open the live league table example
More: Data Tables examples · Getting started with Data Tables · How to sort a table · All free plugins